
Team Productivity Analytics
How can you lead a team if you can’t see how it performs?


Catalin Pitis
/
Co-founder & CFO
Pebbles Ai gave us visibility we never had. I can now pinpoint exactly where our teams excel, where we’re losing time, and how to reallocate resources for max impact.

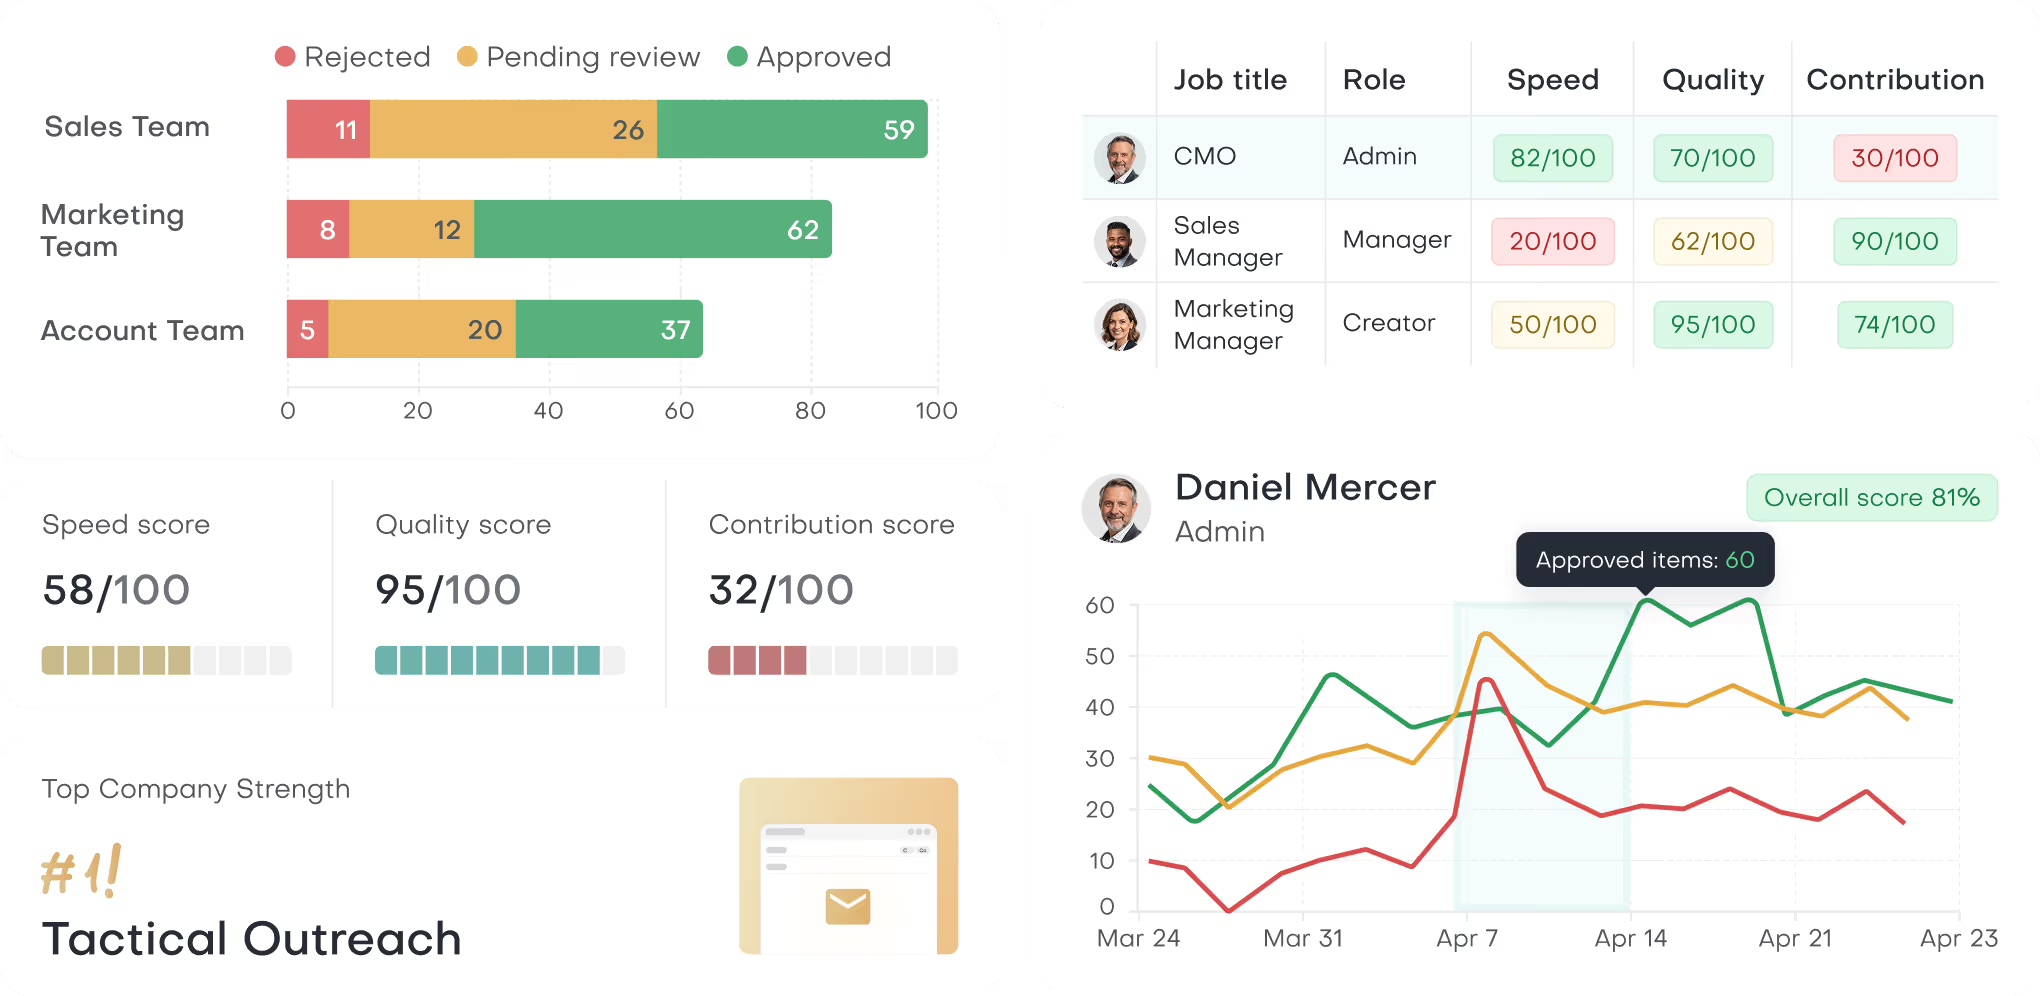
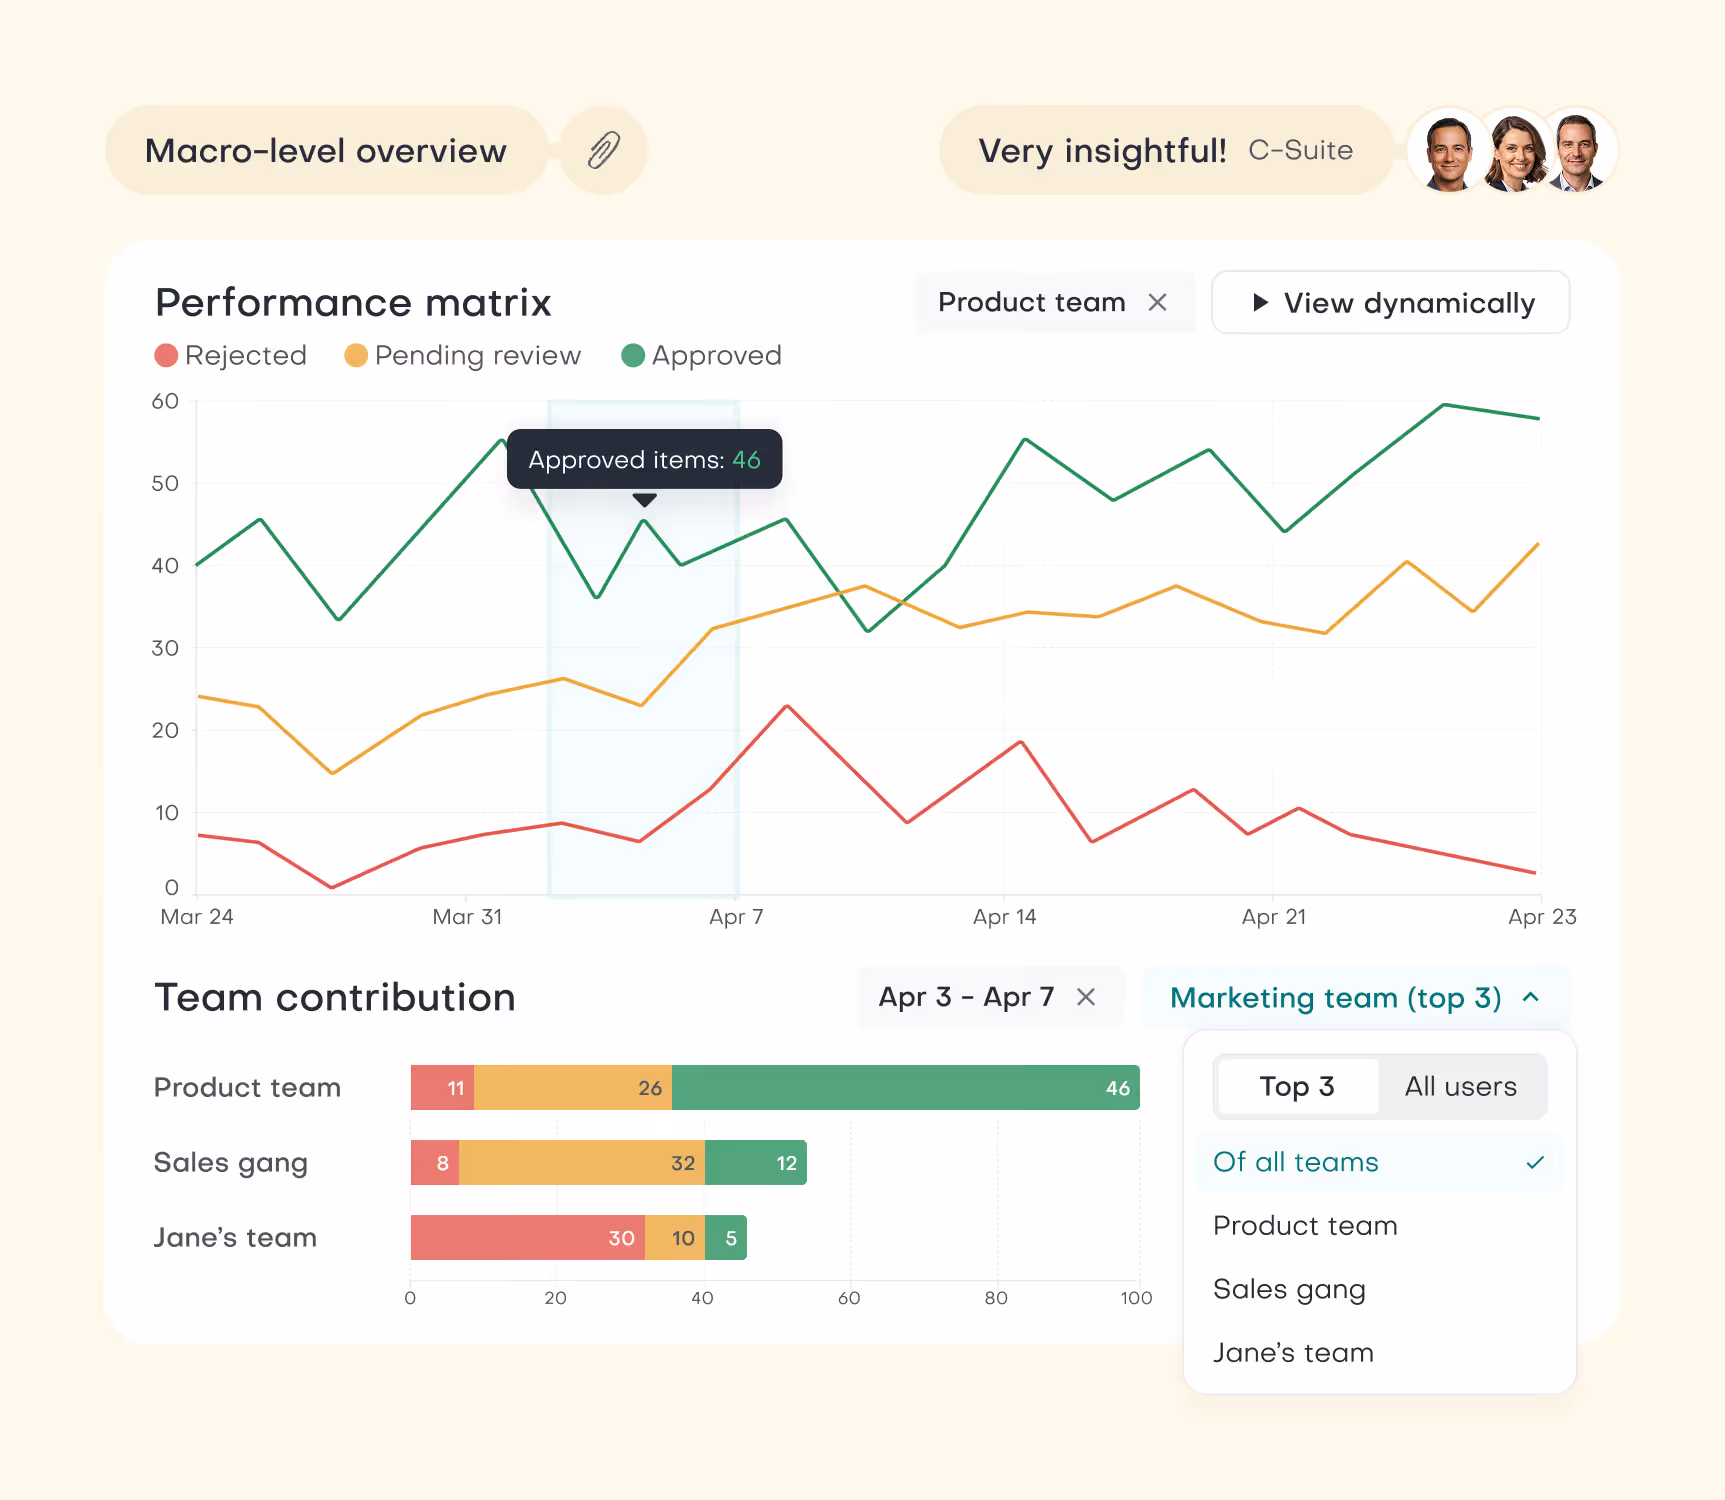
Company Performance
Leaders that align GTM teams with data-driven OKRs outperform competitors by 3x.

Performance trends reveal which teams are gaining momentum or falling behind
Snapshot view compares performance across teams at a single moment
Dynamic graph highlights patterns, outliers, and inflection points in real time
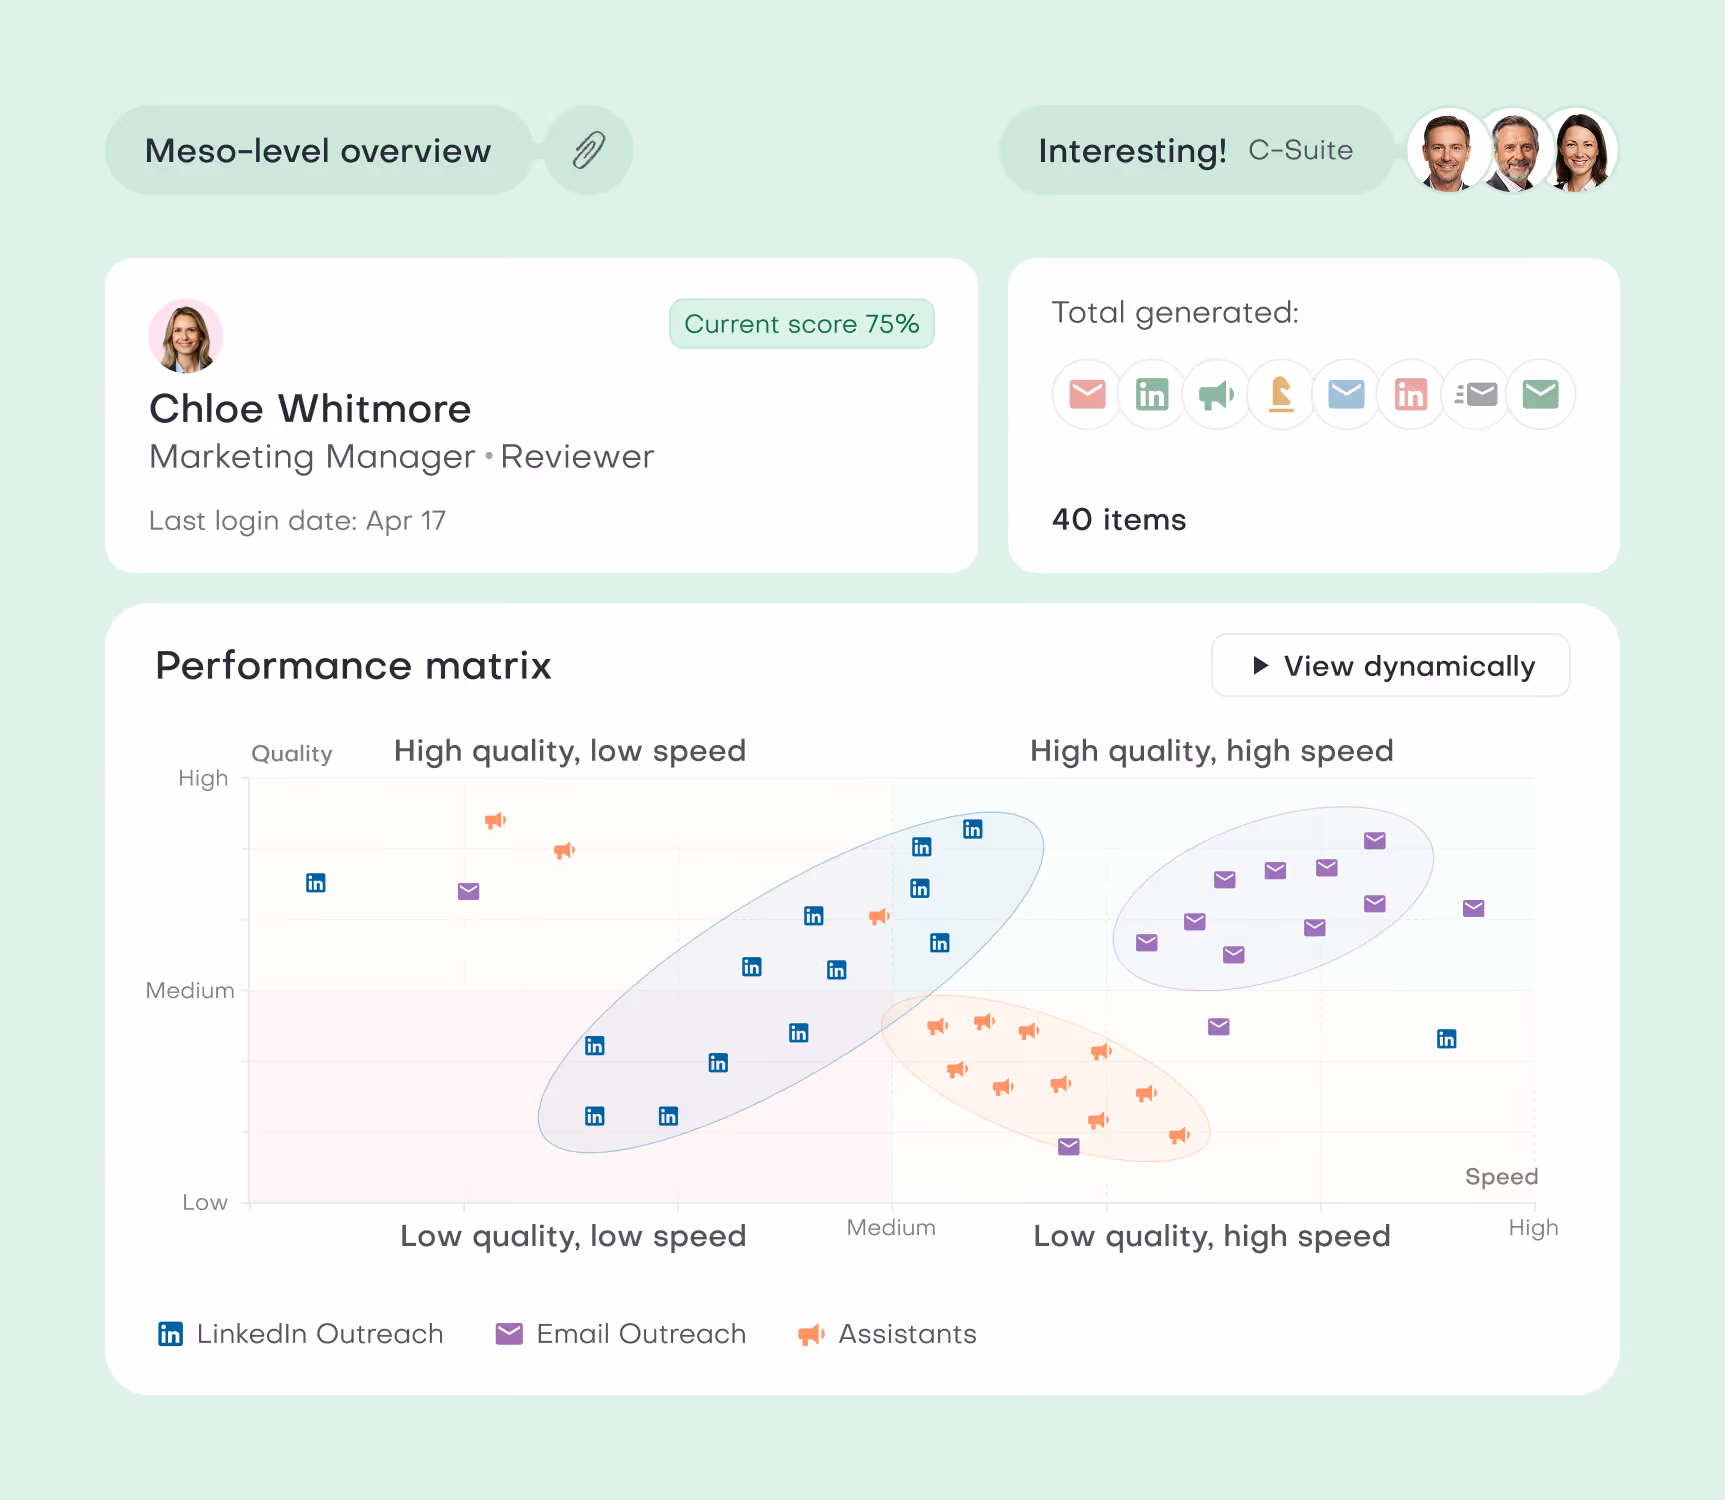
Individual Performance
Cut misallocation by up to 27% with clear insight into who to promote, train, or cut.
Overall score based on a formula weighing speed, quality, and contribution
Total generated items showing how much an individual has contributed
Dynamic scatter plot reveals patterns, outliers, and trends over time
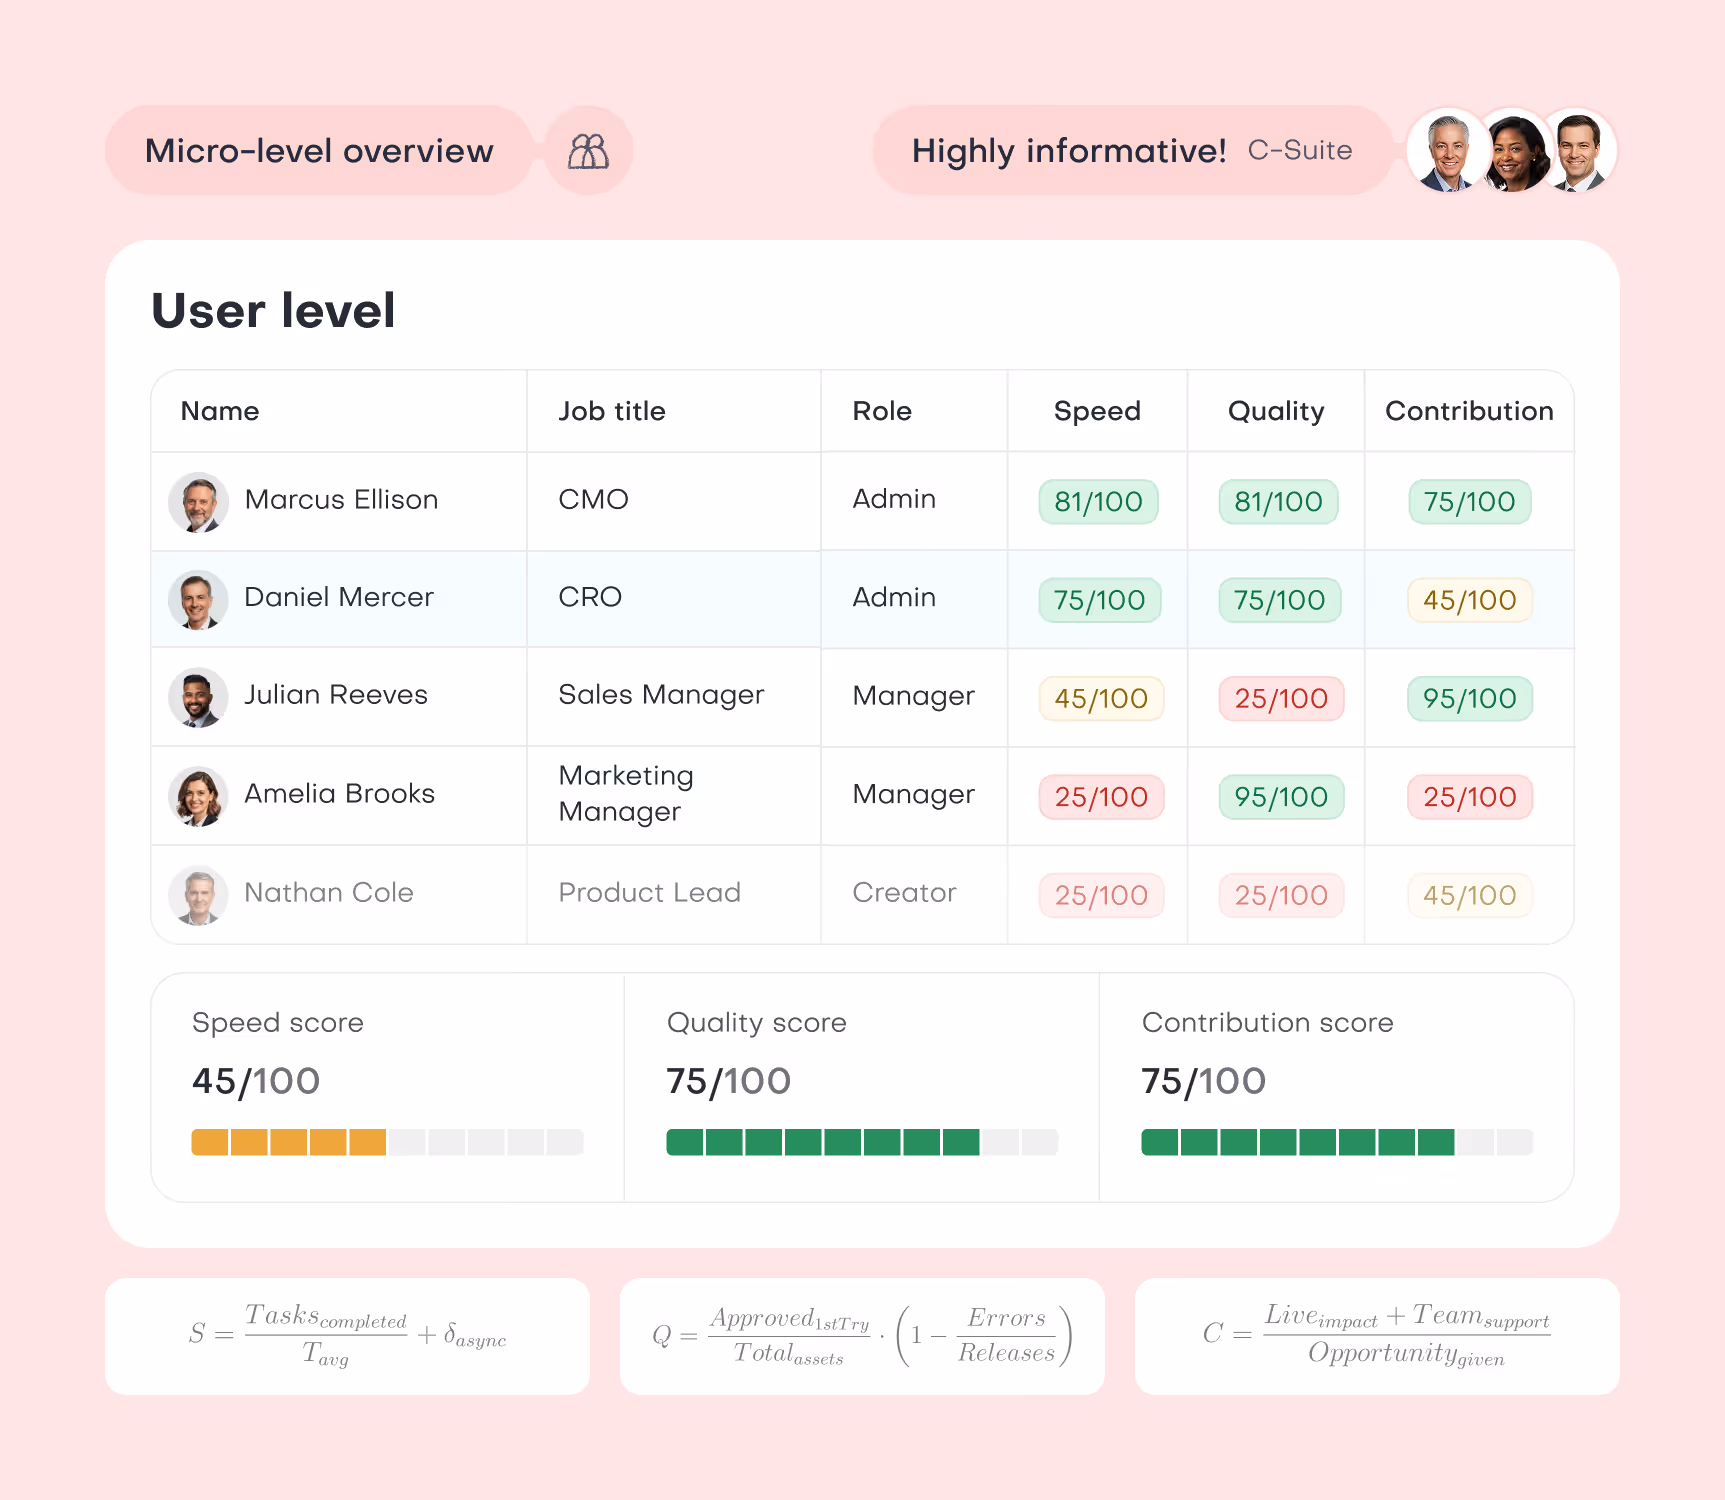
Productivity Scores
OKR tracking unlocks up to $1.2M in annual productivity gains per 100 employees.
Speed reflects task pace, factoring in async effort and output volume
Quality measures accuracy through first-tries and error-free releases
Contribution tracks volume and support relative to company’s needs
Running before lunch

Onboard your company
Invite your team

Start executing


Sviat Luchyn
/
Founder & CEO
/
Design
#desigh
#outreach
#leadgen
Frequently asked questions


.svg)


